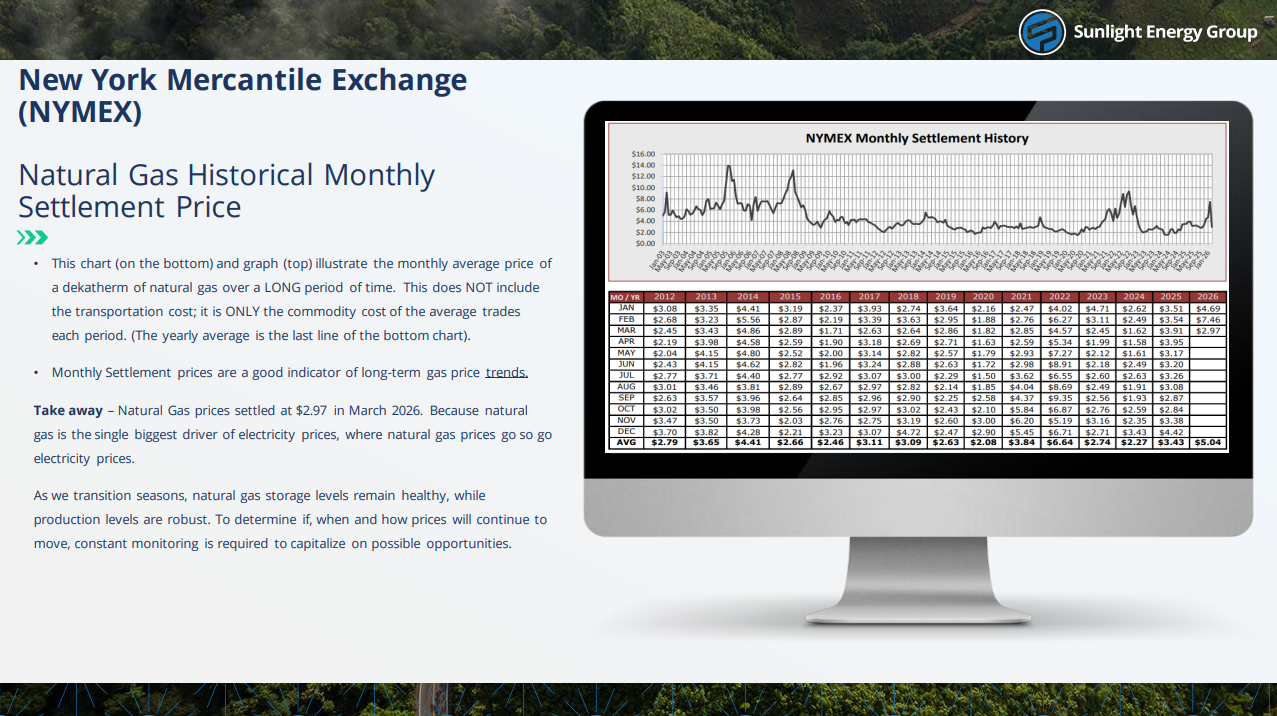
March brought mixed energy market signals. Global liquefied natural gas (LNG) prices rose as conflict involving Iran and supply outages in Qatar and Australia increased concern about near-term global supply. However, U.S. natural gas prices moved lower, with April gas falling from $3.02 to $2.89 per million British thermal units (MMBtu) between March 16 and March 23. Strong U.S. production, milder weather, and healthy storage levels helped keep domestic market conditions softer heading into spring. In short, global supply risks supported international gas prices, while the U.S. market remained relatively well supplied.
Bull Factors:
– Global LNG supply tightened as damage at Qatar’s Ras Laffan facility reduced about 17% of Qatar’s liquefied natural gas (LNG) production, and a cyclone in Australia temporarily shut in about 8% of global LNG supply. The JKM (Japan-Korea Marker, a key global LNG price benchmark) near-term price rose relative to longer-term prices, showing buyers were paying more for immediate supply. Tighter global supply can increase demand for U.S. gas exports, which may help support U.S. natural gas prices.
– U.S. LNG export demand remained exceptionally strong, averaging 19.5 Bcf/day year-to-date versus 15.6 Bcf/day last year, a demand gain of about 3.9 Bcf/day. Even though domestic prices weakened during March, export demand continued to absorb a large share of U.S. production. Fundamentally, when more U.S. gas is pulled into export markets, less is left in the domestic system, which tightens balances and supports both natural gas pricing and power market sentiment in the U.S.
– U.S. export capacity continued to grow as Corpus Christi LNG Terminal added another liquefaction train (equipment used to convert natural gas into LNG for export). Two more trains are expected by the end of 2026. Each new export train increases long-term demand for U.S. natural gas, which can gradually tighten supply and support prices.
– Geopolitical risk increased due to ongoing tensions involving Iran near the Strait of Hormuz, a key global energy shipping route. When supply routes are at risk, markets often price in potential disruptions, which can lift energy prices broadly, including U.S. natural gas and electricity.
Bear Factors:
– U.S. natural gas production remained strong, averaging 108.5 billion cubic feet per day (Bcf/day) year-to-date compared to 103.9 Bcf/day last year, an increase of about 4.5 Bcf/day. When supply grows faster than demand, it becomes harder for prices to rise, which can put downward pressure on natural gas markets.
– U.S. natural gas production remained strong, averaging 108.5 billion cubic feet per day (Bcf/day) year-to-date compared to 103.9 Bcf/day last year, an increase of about 4.5 Bcf/day. When supply grows faster than demand, it becomes harder for prices to rise, which can put downward pressure on natural gas markets.
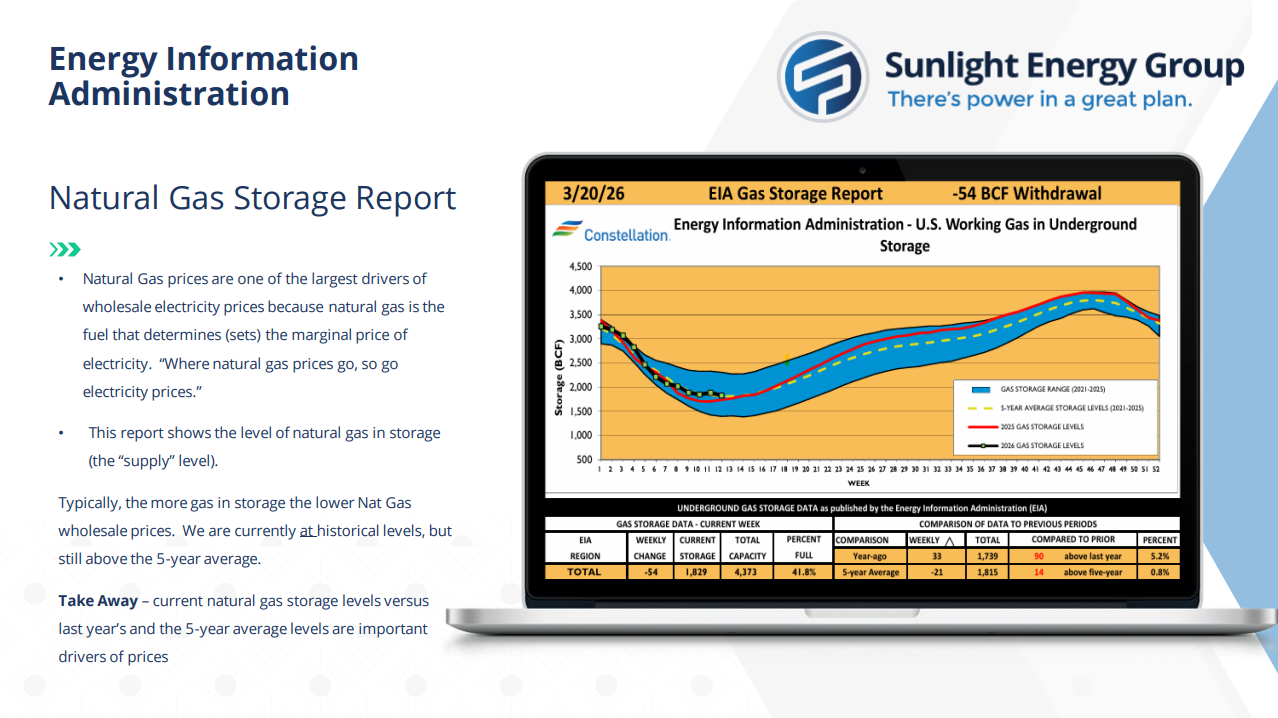
-Storage levels remained healthy, with 1,883 billion cubic feet (Bcf) in storage for the week ending March 13. This was 47 Bcf above the five-year average and 177 Bcf higher than last year. When storage is above normal, the market feels less urgency about supply shortages, which can weigh on prices.
Final Takeaways:
U.S. natural gas prices moved lower in March, even though global liquefied natural gas (LNG) markets became tighter. This shows that, in the near term, U.S. prices were driven more by strong domestic supply, mild weather, and comfortable storage levels than by overseas disruptions. U.S. production remained well above last year, while demand from homes and businesses stayed softer, which kept downward pressure on prices. At the same time, supply problems in places like Qatar and Australia supported global LNG prices and reminded the market that international events can still affect U.S. energy sentiment quickly. Looking ahead, spring weather may continue to keep demand and prices relatively soft in the short term, although growing LNG exports and steady power demand could provide support over time.
Charts and graphs sourced from Constellation