(July 31st 2026)
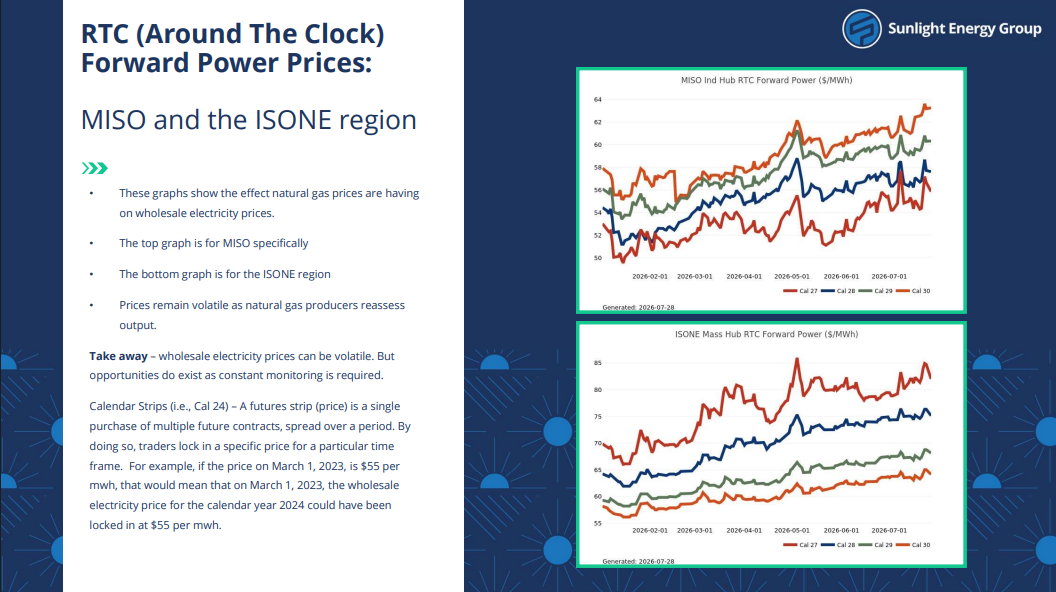
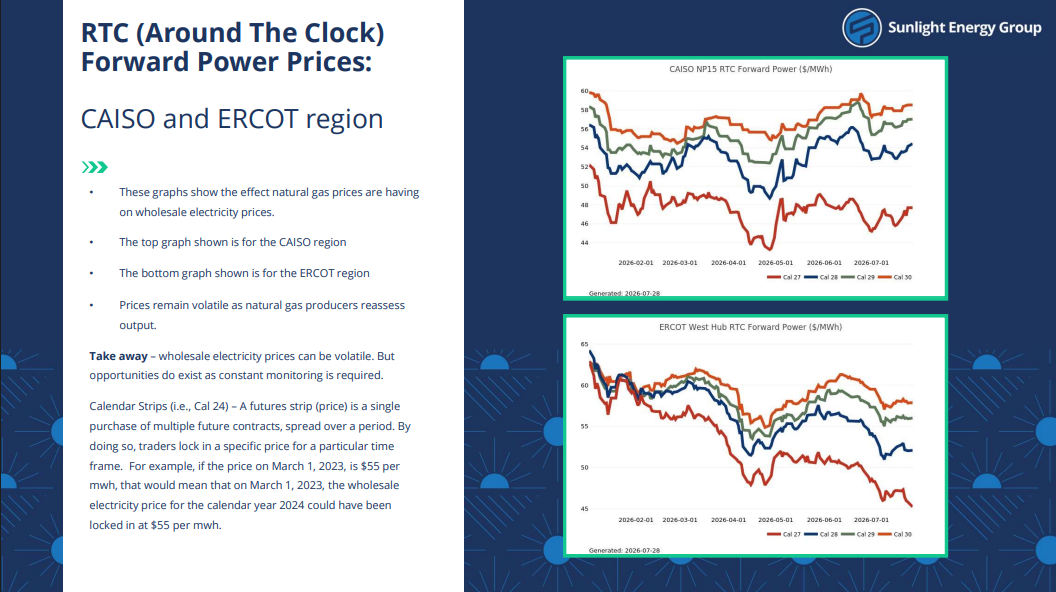
July delivered the first major heat of the summer, and U.S. natural gas markets absorbed it comfortably. Even as record-breaking electricity demand swept across Texas and the eastern United States, the domestic market stayed well-supplied: production held at record levels and underground storage kept building toward a potential full-storage finish before winter. The bigger wildcard sat overseas. A June ceasefire had briefly raised hopes that the Strait of Hormuz would reopen and that Qatar, whose Ras Laffan facility was damaged in a March attack that knocked out a meaningful share of its liquefied natural gas (LNG) capacity, could begin restoring exports. That optimism unraveled when the ceasefire broke down and, on July 7, a Qatari LNG tanker was attacked in the strait, forcing QatarEnergy to again halt production at the world’s largest LNG plant and keeping global supply tight. In short, the U.S. market exited July more comfortably supplied than it entered, even as international supply risk flared back up.
Bull Factors:
–The scale of the global liquefied natural gas (LNG) shortfall is substantial. The disruptions centered on Qatar have taken roughly 10 billion cubic feet per day (Bcf/day) offline, about 20% of global LNG supply, after the March strike on Ras Laffan knocked out two liquefaction trains representing 17% of Qatar’s export capacity. QatarEnergy has had to purchase dozens of replacement cargoes to cover its own contracts, pegs its lost revenue at roughly $20 billion per year, and expects repairs to take up to five years. Shipping through the Strait of Hormuz is still running near 10 vessels per day against roughly 88 before the conflict. For U.S. markets, with Europe historically sourcing 12% to 14% of its LNG from Qatar, that lost supply has to be replaced somewhere, and the United States is the largest available alternative. That sustained pull on American exports tightens domestic balances and puts steady upward pressure on both natural gas and power prices over time.
– U.S. liquefied natural gas (LNG) export capacity continued its multi-year expansion. The U.S. Energy Information Administration (EIA) expects LNG exports to rise nearly 30% by 2027, with net exports climbing 18% to 18.7 Bcf/day in 2026 and another 10% in 2027. New capacity from Corpus Christi Stage 3 and the first Golden Pass trains is ramping this year, with Port Arthur, Rio Grande, and the final Golden Pass train due next year. For U.S. markets, every new export train permanently pulls gas out of the domestic system, which is a structural tightening force that supports higher prices in the second half of 2026 and beyond.
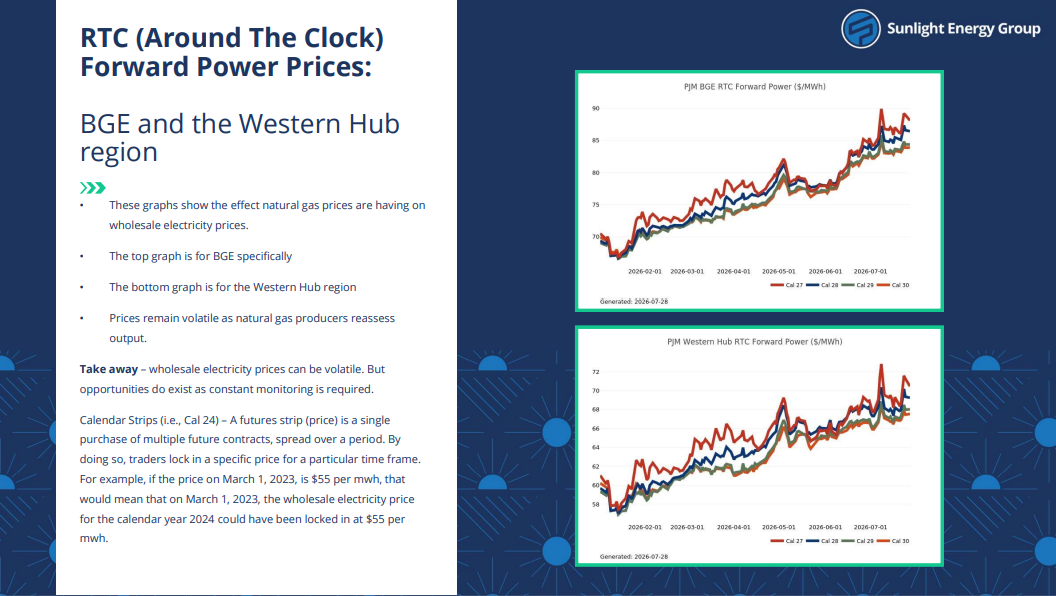
– Electricity demand set records across the country, confirming that structural load growth is now the dominant long-term force in power markets. The Electric Reliability Council of Texas (ERCOT) broke its all-time demand record twice in two days in late July, peaking near 91,300 megawatts (MW), while PJM Interconnection approached its own 2006 record during the early-July heat wave. PJM projects peak demand will grow by 32 gigawatts between 2024 and 2030, with all but 2 gigawatts of that coming from data centers. For U.S. markets, this relentless demand growth means more gas-fired generation and higher wholesale power prices over the long run, even in months when other factors keep a lid on prices.
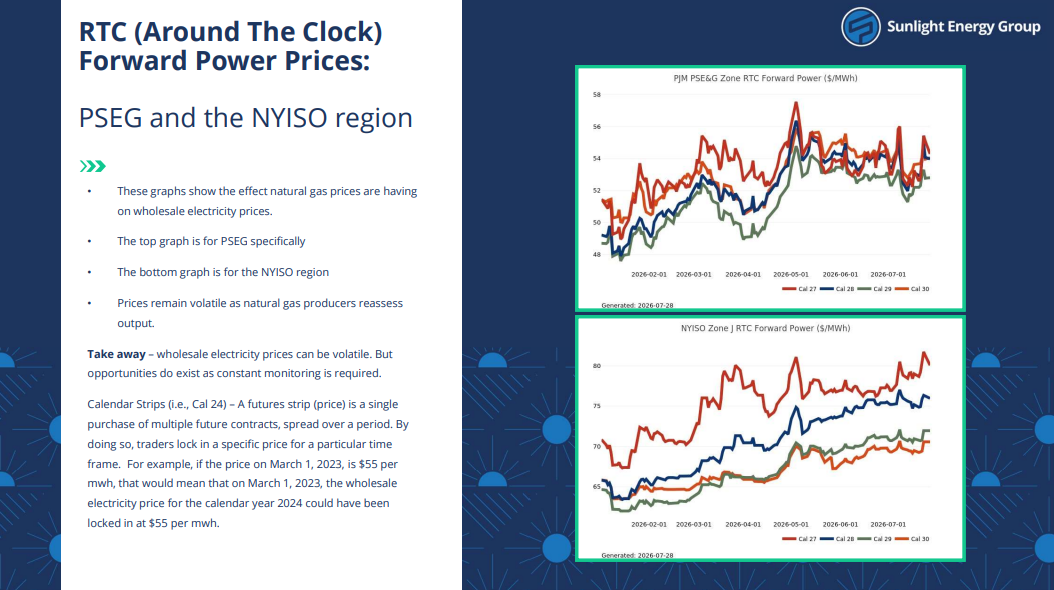
– Capacity markets in the Mid-Atlantic and Northeast continued to clear at record highs. PJM’s most recent capacity auction cleared at its price cap and still fell roughly 6.8 gigawatts short of its reliability target, the third straight auction to hit the cap, while the New York Independent System Operator (NYISO) saw New York City capacity clear at a record near $32.6 per kilowatt-month for the summer. Capacity charges are the fees generators receive simply to stay available during peak demand. For U.S. markets, these record charges flow directly into commercial and residential electricity bills across the 13-state PJM footprint and New York, meaning customers should expect higher power costs regardless of how fuel prices move.
Bear Factors:
–The standout story of the month: record heat did not translate into the gas burn the market expected, because renewables absorbed much of the demand. During the early-July heat wave, strong wind generation across ERCOT and the Midwest, along with growing solar output, muted the need for gas-fired power. The result was a storage injection for the week ending July 3 that came in larger than forecasters predicted, even though the period covered some of the hottest weather in years. For U.S. markets, this is the clearest near-term bearish signal there is: when even a record demand event fails to tighten the market, it tells you the cushion is deep and the price impact of summer heat is smaller than it used to be.
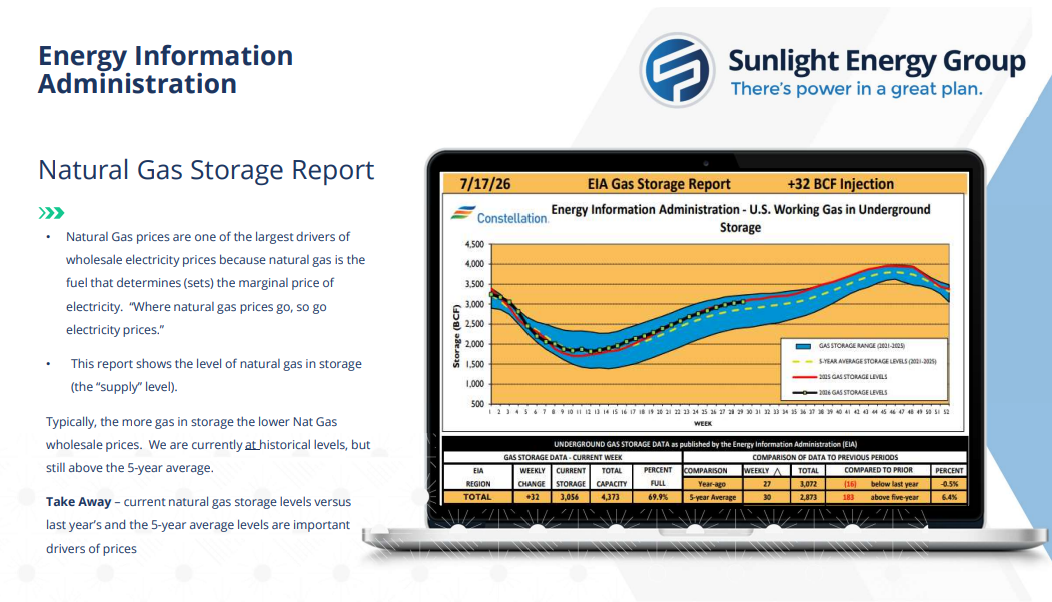
– Underground storage is building toward a potential record and possible full-storage finish before winter. U.S. working natural gas in underground storage reached 3,056 Bcf by the week ending July 17, roughly 6.4% above the five-year average, with the surplus widening rather than shrinking through the peak of summer. For U.S. markets, storage is essentially the country’s natural gas savings account, and the fuller it gets, the less urgency the market feels about supply. That directly pressures near-term prices lower and provides a cushion against price spikes heading into winter.
– Near-term LNG export volumes are set to ease during the remainder of peak summer as U.S. liquefaction facilities run scheduled maintenance. For U.S. markets, every cubic foot of gas that isn’t shipped abroad stays in the domestic system, which builds storage faster and adds to the well-supplied picture. It’s a temporary, mechanical drag that runs counter to the strong long-term export demand story, and it’s weighing on prices right now.
Final Takeaways:
July was the month record demand met record supply, and supply won. The first major heat of the summer pushed electricity demand to all-time highs in Texas and near-records in the Mid-Atlantic, yet natural gas stayed comfortably supplied thanks to record production, a storage surplus that widened even through the heat, and renewable generation that quietly absorbed much of the load. The one place stress persisted was overseas, where the Strait of Hormuz flared up again and kept global LNG supply tight. The longer-term picture has not changed: relentless data center growth, expanding LNG exports, and record capacity charges all point toward firmer conditions ahead. But July made clear that the day-to-day tightening power of summer heat is weaker than it once was, now that wind, solar, and record domestic production stand between hot weather and higher gas burn.
Charts and graphs sourced from Constellation
Sources:
– U.S. Energy Information Administration — Short-Term Energy Outlook (July 2026) and Today in Energy (LNG export forecast)
– American Gas Association — Natural Gas Market Indicators (July 9, 2026)
–U.S. Department of Energy — Section 202(c) Emergency Orders
-New York Independent System Operator (NYISO) and Modo Energy — New York capacity prices