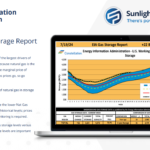
Over the past few months, we’ve experienced some of the hottest summer temperatures since the 1950s. June 2024 set a new record as the hottest month ever, and July is on track to follow suit. Despite these extreme temperatures, natural gas storage levels remain robust, with supply continuing to meet the heightened summer demand. As of the week ending July 19, 2024, natural gas inventories in underground storage reached 3,231 Bcf (billion cubic feet), with a weekly injection of 22 Bcf. Production levels have also stayed consistent, averaging 102.1 Bcf per day throughout July. With healthy storage levels and steady production rates, the market continues to meet the increased demand of a record-setting summer.
Bull Factors:
– June 2024 marked the hottest month on record since 1950, with July likely to follow suit. While the intense heat in the West has slightly subsided, it continues to impact the Midcontinent and East.
– Chesapeake Energy Corp. indicated in the last week of July that it will persist in reducing natural gas production until market prices recover, following the strategy outlined earlier this year.
– The Freeport LNG export terminal has resumed full operations after a temporary shutdown on July 7. This return to full output marks a significant recovery for the facility, ensuring it can continue to meet global demand for liquefied natural gas. By resuming full output, the terminal increases the export capacity, potentially drawing down excess inventories and balancing the market. In July, LNG exports averaged 11.8 Bcf per day, down from 12.7 Bcf per day during the same period last year.
– Natural gas inventories in underground storage for the week ending July 19, 2024, stand at 3,231 Bcf, with a reported injection of 22 Bcf. These inventories are 456 Bcf above the five-year average and 249 Bcf higher than levels at the same time last year.
– Currently, weather outlooks for the latter half of August show a return to warmer than-normal temperatures, albeit not to the extent of some of the heat we’ve seen so far this summer.
Click below to swipe between pages
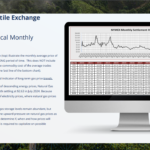
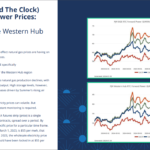
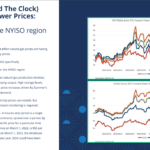
Charts and graphs sourced from Constellation
