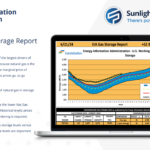
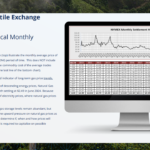
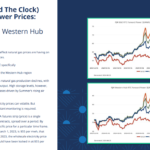
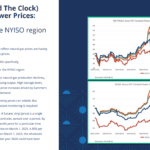
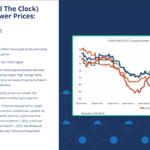
As summer starts off in full swing temperatures across the U.S. trend higher. The 11-15 day forecast is “hotter than normal” across the country. Experts are expecting the summer temperatures to put upward pressure on natural gas prices as the hotter it is the higher air-conditioning demand tends to go. For the week ending June 21, 2024, natural gas inventories in underground storage reached 3,097 billion cubic feet (Bcf). This includes a reported injection of 71 Bcf for the week ending June 6, 2024. Natural gas inventories are currently 528 Bcf)above the five-year average and 314 Bcf higher than the same period last year.
Bull Factors
– June 2024 is set to be the hottest on record since 1950, with widespread heat from the Midwest to the East Coast. The 11-15 day outlook predicts persistently higher-than-normal temperatures nationwide, with any dips in temperature expected to be brief. This ongoing and extended trend of hot weather is likely to increase demand for natural gas as more energy is used for cooling, potentially driving up natural gas prices in the energy markets.
– Demand for gas-fired electric generation has seen a significant increase. Currently, it has surged to 45 billion cubic feet (Bcf) per day, up from an average of 32 Bcf per day just three weeks ago. This means that 45% of all natural gas produced is now being utilized in combined-cycle natural gas-fired electric generating turbines. Month-to-date, demand for natural gas in the power sector has increased by 6% compared to the same period last year. Year-to-date, this demand has risen by 4.5%.
Bear Factors:
– For the week ending June 21, net injections into storage totaled 52 Bcf, significantly below the five-year (2019–2023) average of 85 Bcf and last year’s figure of 81 Bcf for the same period. Currently, working natural gas stocks stand at 3,097 Bcf, which is 528 Bcf (21%) above the five-year average and 314 Bcf (11%) higher than this time last year. Although injections level have tailored off overall storage levels still remain at a surplus.
Click below to swipe between pages
Charts and graphs sourced from Constellation
