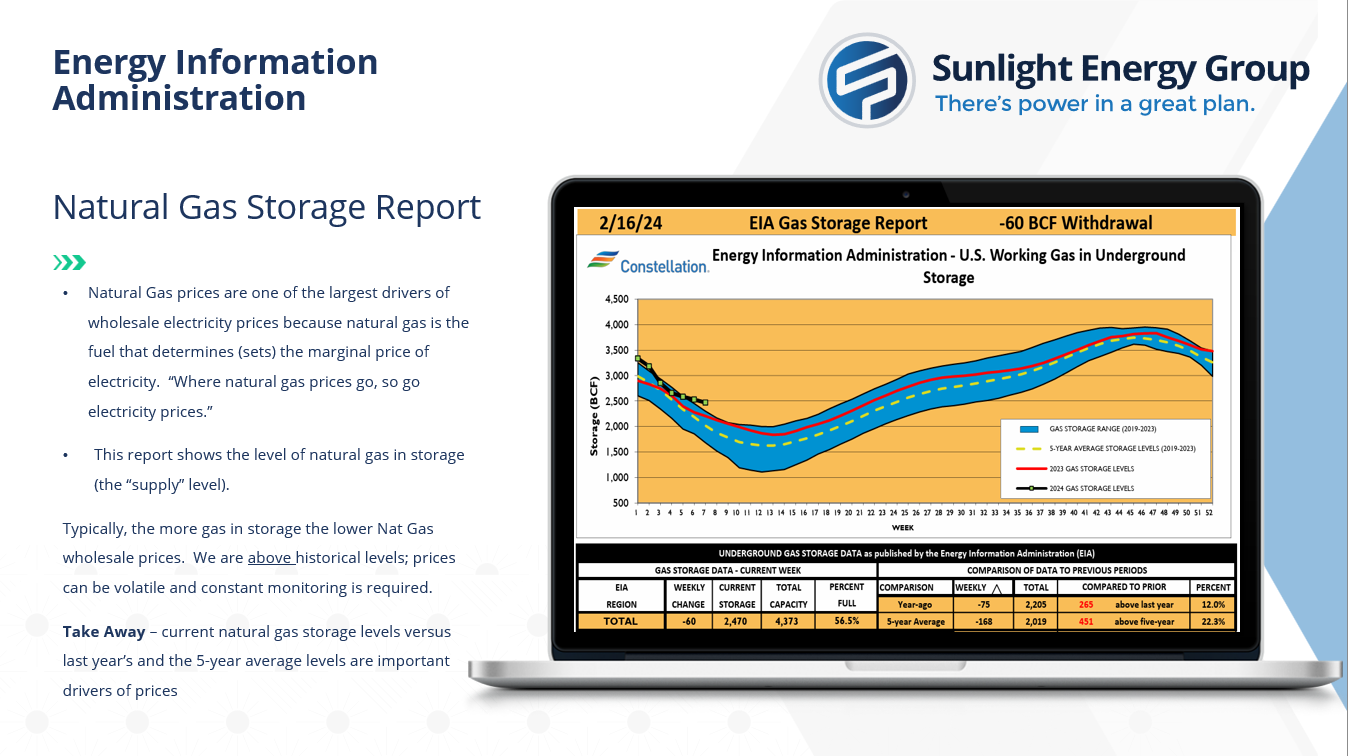
In the month of February we continue to experience healthy storage levels, as reported by Constellation in the week ending February 16th, natural gas in underground storage was around 2,470 billion cubic feet (BCF). Which is still 12% higher than levels a year ago and 22.3% higher than the 5-year average.
Bull Factors:
– A few US natural gas producers have announced production cuts for the year of 2024. Chesapeake Energy, soon to be the largest domestic producer of US natural gas after its completed merger with Southwestern Energy. on February 21st announced that it will look to reduce its production by 30% for the year of 2024. Natural gas prices soared 13% after the announcement was made. Antero Resources and Comstock Resources have also lowered their production guidance for the year of 2024 citing that the natural gas markets are “clearly oversupplied”.
– Natural gas demand reached its highest last month of January. Based on reports from the U.S. Energy Information Administration (E.I.A.), an estimate of 118 billion cubic feet was consumed which is the most of any month on record so far. The E.I.A has also projected a slight increase in natural gas consumption by the residential and commercial sector in 2024.
Bear Factors:
– Above average Winter temperatures continue to apply significant downward pressure on short-term natural gas prices. Lowered overall seasonal demand has reduced large withdrawals from U.S. inventories causing surplus and pushing natural gas prices close to its lowest in 30-years.
– Robust natural gas production continue to also impose downward pressure on natural gas prices in the short-term. Natural gas production for February has averaged 104.9 Bcf per day, which is up 3.9 Bcf per day compared to last month and 4.5 Bcf per day year over year.
– As indicated in previous points, natural gas storage levels also continue to be at a surplus. Natural gas inventories are 451 Bcf greater than the five year average and 265 bcf greater than last year February in the week ending February 16th.
Click below to swipe between pages
Charts and graphs sourced from Constellation